By Rod Fisher
The pulp and paper industry now has a way to evaluate its carbon emissions
completely and comprehensively. A new model, analyzing the carbon footprint
of every pulp and paper mill in the world, shows some startling differences
across the industry.
REGIONAL DIFFERENCES
Asia, the largest emitter, produces 65% more carbon per-ton-of-paper
produced than the most efficient producer, Latin America. Moreover,
because of its large volume of production, Asia is responsible for nearly
seven times the total amount of Latin America's carbon and 41% of the
industry's total global carbon emissions. The North America paper industry
emits 23% of the paper industry's carbon, and Europe 30% (Figure 1).

Each region's carbon emissions come from a different mix of sources.
Asia, for example, produces a relatively high amount from burning fossil
fuels, whereas North America's paper industry has a higher proportion
from purchased electricity.
The data above, associate carbon emissions from market pulp with mills
that use it and, therefore, do not include carbon emissions from mills
producing the market pulp.
MILL-TO-MILL DIFFERENCES
There are huge differences in carbon emissions between mills both in
total and on a per-ton-of-paper basis. The average of the fourth quartile
of producers emits nearly 80% more carbon per ton than the average mill
in the first quartile of CO2 emissions (Figure 2). Interestingly, the
range of emissions in every region is approximately the same. However,
the shape of the regional curves are quite different resulting in big
differences in the average emissions of regions.

GRADE DIFFERENCES
Surprisingly, the differences between grades are much smaller. Tissue
and Towel is responsible for the most carbon per ton of paper produced,
but only by 23% more than Packaging, the lowest per-ton emitter. Packaging,
being a large segment of course, is responsible for the majority of
the industry's carbon at 55% (Figure 3).

COMPANY DIFFERENCES
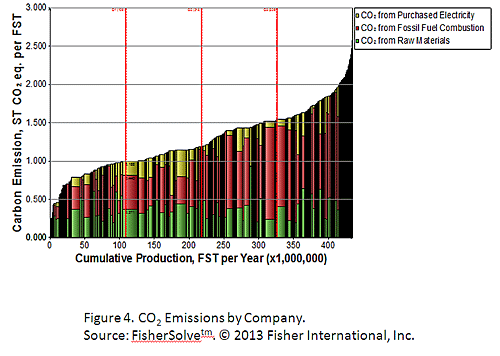
As in the case of individual mills, there is a significant difference
in the carbon outputs between companies. The average of the fourth quartile
emits roughly 2.25 times the carbon as the average of the first quartile
(Figure 4). Even within grades and regions, there are big differences
between companies with fourth quartiles averaging twice that of first
quartiles in most cases.

ABOUT CARBON BENCHMARKING
The carbon emissions model used for this article, comes from Fisher
International's FisherSolve™ Carbon Benchmarking module. Based on its
mass-energy model of every mill in the world, the system calculates
carbon emissions from "cradle-to-gate" and even "cradle-to-destination."
This means that it accounts for all carbon emissions from making each
Finished Product on each machine including: carbon associated with the
manufacture and transport of raw materials; the production, transport,
and combustion of fuels in the mill; the purchase of electricity; and
the transport of parent rolls of paper to any of 100 destinations in
the world.
The model allows analysis down to the paper machine-Finished Product
level and can roll up analysis to any level above. Carbon Benchmarking
will be widely available for the industry to use and Fisher hopes that
it can become a standard tool for considering policy and commercial
issues.
Rod Fisher is president of Fisher International, Inc. and can be
contacted at: rfisher@fisheri.com.
More information is available at www.fisheri.com.


