 TAPPI’s Visual Inspection Tools: A Trusted Resource for Precision and Reliability
In the dynamic landscape of quality assurance, precision and reliability are paramount. Visual inspection tools play a pivotal role in identifying imperfections and ensuring product excellence. For over 85 years, TAPPI has stood as a beacon of trust in providing the highest quality Estimation Charts. These charts have become an industry standard, aiding customers in the meticulous detection of particulates, embedded defects, or inclusions.
Trusted Resource
TAPPI has consistently proven itself as a trusted provider of estimation charts, solidifying its position as a leader in quality assurance solutions. As an ANSI-Certified Standards development organization, TAPPI's commitment to excellence is underscored by its peer-reviewed Standards, ensuring that products meet industry-recognized best practices. This level of scrutiny provides customers with the confidence that TAPPI's Estimation Charts meet the highest standards of quality and accuracy.
A Comprehensive Solution
TAPPI's Estimation Charts cover a broad spectrum of visual inspection needs. Whether you are inspecting forest product materials, plastics, tubing, textiles, or other materials, TAPPI has you covered. The comprehensive range of charts includes size estimation charts, dirt charts, and calibrated size estimation charts. This diversity ensures that TAPPI can meet the unique requirements of various industries, offering solutions for different materials and applications.
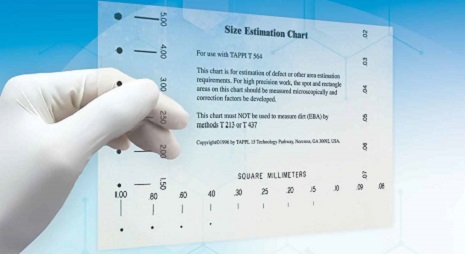
- Size Estimation Charts (SEC)
Transparent charts used to measure the size of spots, defects, or inclusions over the range of 0.02 to 5.00 square millimeters. The charts can be used in a large number of applications where there is a need to estimate a size (area) by way of a direct comparison to a known circular area. Instructions for use of this transparency are outlined in TAPPI Test Method T 564.
- Calibrated Size Estimation Charts (CSEC)
These charts are a great solution for quality control applications where exact dimension specifications are required. Size Estimation Charts that have been individually calibrated and certified within tolerance save customers time from having to calibrate estimations themselves. Each dot is calibrated using a high-powered microscope and issued a data confirmation sheet. Each calibrated chart bears a security hologram with a serial number that is trackable to each data sheet. Instructions for use of this transparency are outlined in TAPPI Test Method T 564.
- Dirt Estimation Charts (DEC)
Opaque charts that are ideal for the estimation of the equivalent black area (EBA) of dirt or other color specks. The template for this chart is the same as the Size Estimation and Calibrated Size Estimation Charts. Its opaque material is conducive to detecting any foreign matter imbedded in material which, when examined by reflected (not transmitted) light, has a contrasting color to the rest of the surface. This opaque chart is to be used with TAPPI Test Methods T 213, T 437, and T 537.
In the dynamic landscape of quality assurance, TAPPI's Estimation Charts shine as a testament to precision, reliability, and trust. With decades of experience and a commitment to exceeding industry standards, TAPPI continues to be a go-to resource for organizations seeking visual inspection tools that elevate their quality control processes. For more information and pricing, please visit our website.